Strategy Tester Report
AlpariUK-Demo (Build 225)
| Symbol | USDCAD (US Dollar vs Canadian Dollar) | ||||
| Period | 1 Hour (H1) 2009.12.01 00:00 - 2009.12.31 18:00 (2009.12.01 - 2010.01.01) | ||||
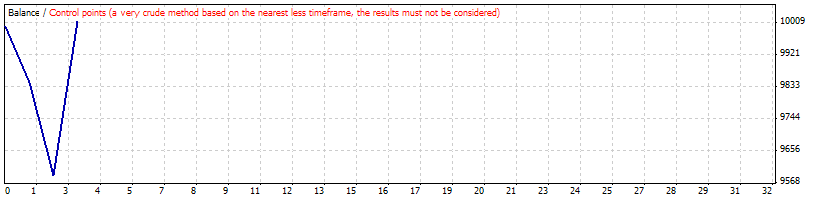
| Model | Control points (a very crude method, the results must not be considered) | ||||
| Parameters | mm=1; reinv=10; MagicNumber=0; SignalMail=false; EachTickMode=false; Lots=0.1; Slippage=3; UseStopLoss=false; StopLoss=200; UseTakeProfit=false; TakeProfit=600; UseTrailingStop=false; TrailingStop=30; maxLots=50; emergencystoploss=true; stoponslowstoch=true; TPonWPR=true; | ||||
| Bars in test | 1515 | Ticks modelled | 13777 | Modelling quality | n/a |
| Mismatched charts errors | 2 | ||||
| Initial deposit | 10000.00 | ||||
| Total net profit | 13.68 | Gross profit | 424.70 | Gross loss | -411.02 |
| Profit factor | 1.03 | Expected payoff | 4.56 | ||
| Absolute drawdown | 1663.44 | Maximal drawdown | 1955.81 (19.00%) | Relative drawdown | 19.00% (1955.81) |
| Total trades | 3 | Short positions (won %) | 2 (0.00%) | Long positions (won %) | 1 (100.00%) |
| Profit trades (% of total) | 1 (33.33%) | Loss trades (% of total) | 2 (66.67%) | ||
| Largest | profit trade | 424.70 | loss trade | -257.37 | |
| Average | profit trade | 424.70 | loss trade | -205.51 | |
| Maximum | consecutive wins (profit in money) | 1 (424.70) | consecutive losses (loss in money) | 2 (-411.02) | |
| Maximal | consecutive profit (count of wins) | 424.70 (1) | consecutive loss (count of losses) | -411.02 (2) | |
| Average | consecutive wins | 1 | consecutive losses | 2 | |
| # | Time | Type | Order | Size | Price | S / L | T / P | Profit | Balance |
| 1 | 2009.12.02 01:00 | sell | 1 | 1.00 | 1.04625 | 0.00000 | 0.00000 | ||
| 2 | 2009.12.02 15:00 | close | 1 | 1.00 | 1.04786 | 0.00000 | 0.00000 | -153.65 | 9846.35 |
| 3 | 2009.12.02 16:00 | sell | 2 | 1.00 | 1.04637 | 0.00000 | 0.00000 | ||
| 4 | 2009.12.02 20:00 | close | 2 | 1.00 | 1.04907 | 0.00000 | 0.00000 | -257.37 | 9588.98 |
| 5 | 2009.12.09 14:00 | buy | 3 | 1.00 | 1.06086 | 0.00000 | 0.00000 | ||
| 6 | 2009.12.14 15:00 | close | 3 | 1.00 | 1.06544 | 0.00000 | 0.00000 | 424.70 | 10013.68 |